Interactive Impact Report
Progressive Turnout Project is the largest voter contact organization in the country. Our mission: Get Democrats to vote. The best way to turn out voters is through one-on-one conversations. We talk to inconsistent voters who are likely Democrats, so they do not need persuading on who to vote for. They just need a nudge, some information, and to hear from a real person. That means every eligible non-voter we are able to reach brings Democrats closer to success on Election Day.
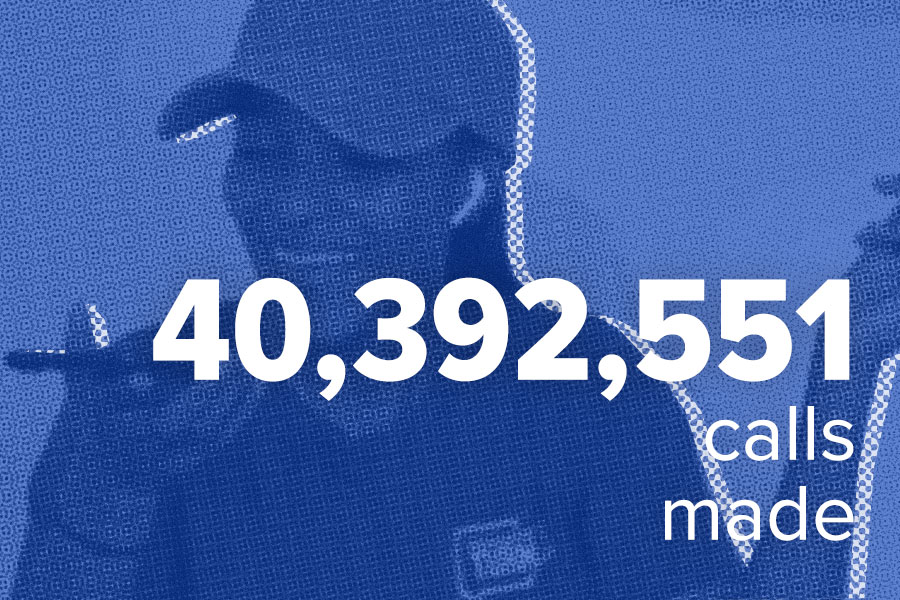
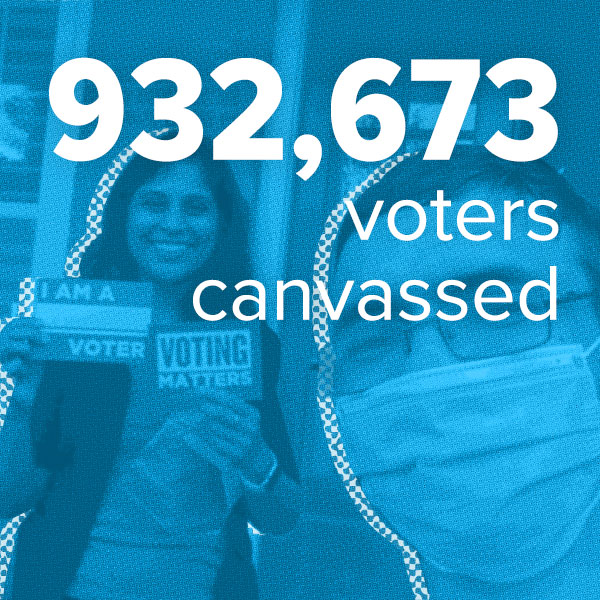
We started our voter turnout program in 2020 by knocking on doors and having face-to-face conversations with voters, but because of the worsening COVID-19 pandemic, we had to adjust our usual tactics. By August, we had converted our door-knocking program with over 1,200 staff in 18 states into a massive phone banking operation. By the end of the election, we had made over 40 million calls and contacted nearly one million voters.
The visualizations on this page provide an interactive look at work of PTP staff in the 2020 election cycle, including the types of voters we targeted, a timeline of our phone banking operation, and the results of our outreach. Besides a staff program, PTP also ran a fellows program and volunteer postcard and phonebanking program; however, the results of those efforts are not included on this page.
2020 Election Recap
You've heard it before, and it's true: the 2020 presidential election was the most important election in a generation. Through the hard work of dedicated volunteers, organizers, activists, and campaign staffers across the country, Joe Biden defeated Donald Trump to win the presidency and the Democrats flipped the Senate.
Democrats won 9 of the 18 states where PTP had a voter turnout program — including Arizona, Georgia, and Wisconsin, where razor thin margins determined the outcome of the elections. Voter turnout reached historic highs in many states and the country saw the highest voter turnout since 1900.
Click on a table column to sort the table by that column and also to change the data shown on the map.
Progressive Turnout Project was one of many organizations in the progressive ecosystem working to get out the vote last November. How did we help Democrats win the presidency and flip the Senate? Read more about our program below.
Our Program
Target Voter Universe
Our target states during the 2020 cycle included Presidential battleground states and states with competitive Senate races in order to help accomplish two of the Democrats' major goals: elect Joe Biden and take back the Senate.
Using modeling and voter file data, we target likely Democratic voters who turn out infrequently or irregularly. Our targets tend to be younger and skew more toward women and people of color than the general voting population.
Click on a table column to sort the table by that column.
Demographic Breakdown
The treemap allows you to visually drill down into each state’s target universe demographics and compare the relative sizes of intersecting demographics.
Select a state from the dropdown menu. Click the demographic buttons to add or remove that demographic from the treemap.
From Doors To Phones
When PTP shifted our conversations from on the doors to phone calls in August of 2020, our voter universe in turn shifted in a dramatic way. While we still focused on contacting likely Democrats, especially those who are less likely to turnout to vote, we were suddenly limited to just the individuals for whom we had phone numbers.
On the other hand, this shift also expanded our universe, allowing us to reach voters outside the geographic radius around our office locations and to reach deeper into states, especially those with significant rural populations. This program shift also had an impact on the age and racial breakdown of our target voters. As our universe expanded beyond large metro areas, our universe became proportionately whiter. Moreover, by switching the phones, the share of our universe made up by voters 65+ expanded greatly in each state.
Change the demographic shown by clicking the dropdown arrow in the chart title. Hover over the lines to see more detail about how a demographic group in a particular state changed between programs.
of Attempted Voters
The map below gives a visual sense of the distribution of our targets during the canvass and phone phases of our program. One dot represents 1/3000th of the selected phase's target universe.
Click a state on the map of the US where we did in person canvassing. Click the two buttons below the state map to toggle between our canvassing and phone targets.
Field Team
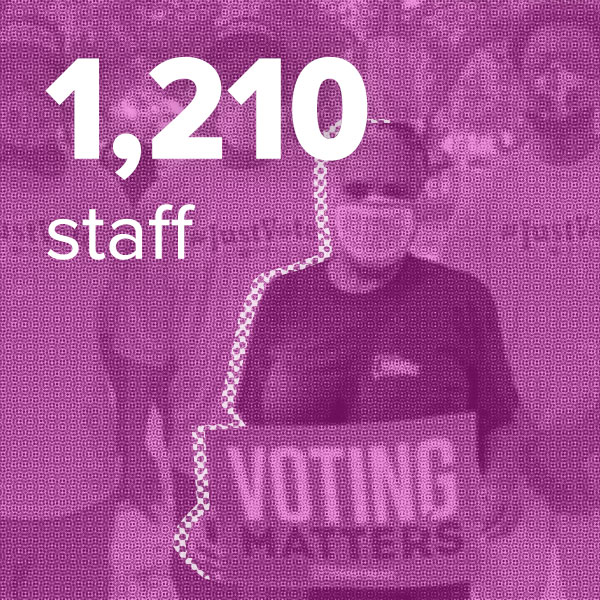
Our field team was a diverse group of 1,210 individuals working in 18 different states, initially based out of 69 different offices during in-person canvassing. A full-time field staffer typically made around four hours of calls five times each week, starting in the early evenings on Mondays, Tuesdays, and Wednesdays and in the late mornings on Saturdays and Sundays.
Because of the differing election timelines in each state, as well as the different sizes of each state’s voter universe and field staff, nearby states were organized into calling regions based on timezone and regional similarity. For example, field staff in South Carolina, Georgia, and Florida were grouped into a Southeast calling region. While field staff in one state waited for vote-by-mail sign-ups in their state, they called into another state in their designated region where sign-ups had started. Furthermore, field staff in states with smaller voter universes could help call through the universes in a larger state while not exhausting their calling lists too early.
Dialer Program Timeline
Our dialer program launched on Saturday, August 15 and continued through Election Day on Tuesday, November 3. For the first eight weeks of calling, we asked voters if they would commit to vote in the November election. If possible in the voter’s state, our field team also asked voters to sign up to vote by mail, guiding them through the process of completing online forms or ballot request portals.
On Saturday, October 10, we shifted from signing up voters to request mail-in ballots to helping voters make a plan to vote. We walked voters through their options, whether voting early in-person, voting by mail, or voting on Election Day, so that they felt ready and prepared to vote. We also continued to reach out to previously unattempted voters to turn them out to vote.
The bar graphs below show the total number of dials, canvassed voters, commitments to vote, vote-by-mail sign-ups, and vote plans created for every day of our program.
Click a state on the map of the US to see our program metrics for that particular state. Hover your cursors over the bars to explore our program in more detail on a particular day. Highlighted states indicate states that PTP staff called into on the selected day.
Our Results
Impact
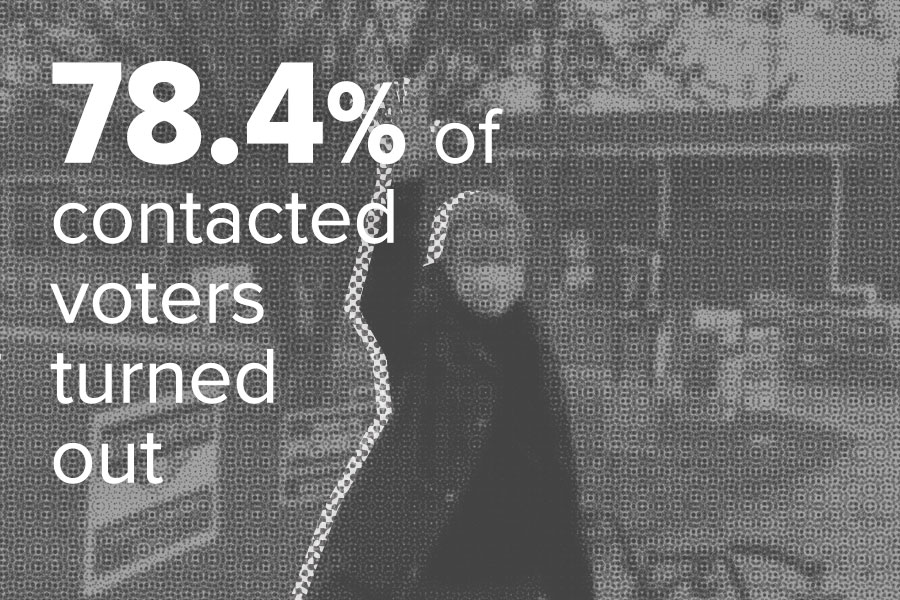
We made more than 40 million dials and successfully canvassed over 900,000 voters over the course of 12 weeks. In 13 of our 18 states, the voters we attempted turned out at a higher rate than the overall turnout. In all 18 of those states, the voters we successfully canvassed turned out at a much higher rate.
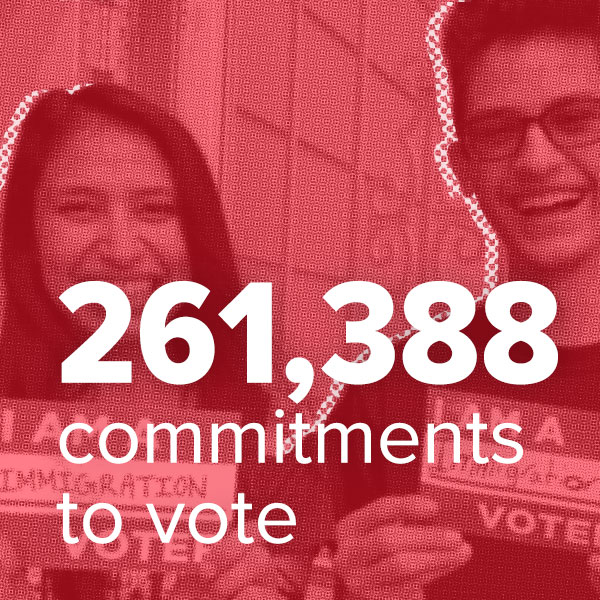
Given how close the election was in certain states, every dial mattered. In Arizona, whose 11 electoral votes were decided by a margin of just over 10,000, the number of commitments to vote we received was over triple Joe Biden’s margin of victory!
Click on a table column to sort the table by that column.
Efficacy of outreach over time
As the election approached, our success in contacting voters (contact rate) trended downward across each of our calling regions, while the rate at which voters did not pick up their phones (not home rate) steadily rose. It is likely that many voters came to expect political calls and simply did not answer phone calls from unknown numbers or unfamiliar caller IDs, rather than even answer the call and ask to be removed from the calling list.
Interestingly, the rate at which voters refused to engage with us (refusal rate) remained stable from week to week. PTP launches its voter turnout program much earlier in the election cycle than most — and our observed trends support that strategy, demonstrating the importance of starting voter contact early, especially to cut through the oversaturation of political outreach close to Election Day.
Hover over an individual state or a line on one of the charts to bring it into focus and highlight the states associated with that calling region.
Conclusion
Despite the pandemic forcing us to change our usual tactics, we had the opportunity to discuss the importance of voting with a larger number and an even wider swath of voters than in our past programs. While we cannot understate the importance of face-to-face voter contact, being able to reach as many voters as possible was absolutely critical in the most important election of our lifetimes. Over 40 million voter contact attempts and nearly one million voters canvassed would not have been possible with our traditional program!
Acknowledgements
This page was created by Sabrina Chan. Special thanks to Anastasia Scourtes for her support and thoughtful advice throughout the creation of this project and to the Progressive Turnout Project team for all of their feedback. The data used in this project was processed using Python, pandas, and Jupyter. This project page was created using D3, Bootstrap, D3-Annotation, and D3-tip. Map tiles by CARTO with data by OpenStreetMap, under ODbL. The source code for this project is available on GitHub.
